An Analysis of the Relationship Between Highway Expansion and Congestion in Metropolitan Areas Lessons from the 15-Year Texas Transportation Institute Study |
Summary
The Texas Transportation Institute’s 1998 annual report on congestion in major metropolitan areas provides a rich set of data and presents new opportunities for research into the effectiveness of congestion management strategies. This report prepared by STPP to supplement TTI’s work examines the performance of road expansion as a congestion relief measure.By analyzing TTI’s data for 70 metro areas over 15 years, STPP determined that metro areas that invested heavily in road capacity expansion fared no better in easing congestion than metro areas that did not. Trends in congestion show that areas that exhibited greater growth in lane capacity spent roughly $22 billion more on road construction than those that didn’t, yet ended up with slightly higher congestion costs per person, wasted fuel, and travel delay. The STPP study shows that on average the cost to relieve the congestion reported by TTI just by building roads could be thousands of dollars per family per year. The metro area with the highest estimated road building cost was Nashville, Tennessee with a price tag of $3,243 per family per year, followed by Austin, Orlando, and Indianapolis.
Introduction: The Importance of the TTI Study
Every year for over a decade, the widely respected Texas Transportation Institute (TTI) has provided the nation with valuable data and analysis about traffic congestion in our metropolitan areas. This year’s release is unprecedented in scope, covering 15 years of data and 70 metropolitan areas. Such a large data set over such a long duration of time provides new research opportunities to better understand the problem of metropolitan traffic congestion.TTI’s data are crucial to understanding how well our metro areas are managing congestion in a variety of settings. This year, for the first time, STPP is using the TTI data to shed some light on the solutions to congestion. In this analysis, we examine the performance of the most common congestion management strategy—roadway construction. In recent years, this strategy has been criticized because numerous studies have found that new roads are ineffective in relieving congestion, and in many cases, have increased traffic. Despite these lessons, many of the nation’s transportation leaders still believe that the answer to bottlenecks and slow-moving traffic is more highways. William Fay, Executive Director of the American Highway Users’ Alliance, for example, recently argued that "There's no mystery about why roads are congested. We aren't building enough new ones."
Putting Congestion Relief Claims to the Test
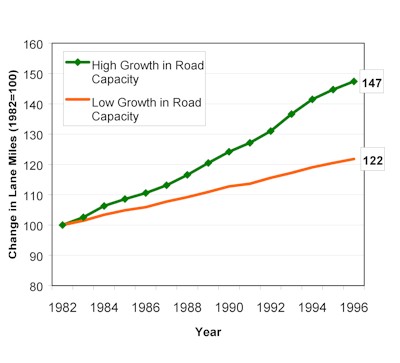
If the assertion that new highways relieve congestion is valid, we would expect to see lower levels of congestion and associated costs in metro areas that invested heavily in road building during TTI’s 15-year study period—between 1982 and 1996. To test this claim, we conducted several analyses. First, we looked at congestion in two types of metro areas: those that exhibited high growth in lane capacity and those that added less lane capacity. We did this by ranking the 70 metro areas studied by TTI based on their growth in lane capacity, and then dividing this list in half. Figure 1 shows how each grouping differs in the amount of lane-miles built during the 15-year period. The 35 metro areas in the high growth in road capacity group increased their number of highway lane-miles by 47% on average. Lane mileage in the low growth group increased by only 22% on average. For a list of these metro areas and their characteristics, see Appendix A.
Figure 1: Changes in Lane Miles in Metro Areas (1982-1996)
We then compared the change in congestion cost per capita for these two groups. This is shown in Figure 2. In spite of the large difference between the two groups in the growth of lane miles, they exhibit no significant difference in congestion cost per capita.
Figure 2: Congestion Costs Per Capita (Mean Dollars)
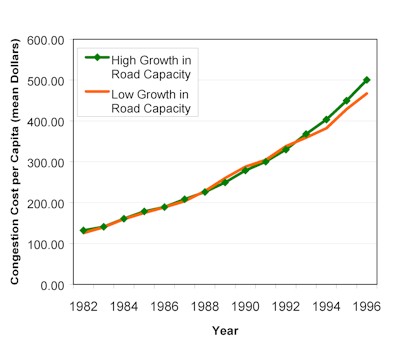
These figures clearly indicate that there is no significant difference in congestion cost per capita between metro areas that invested heavily in highway construction and those that did not.
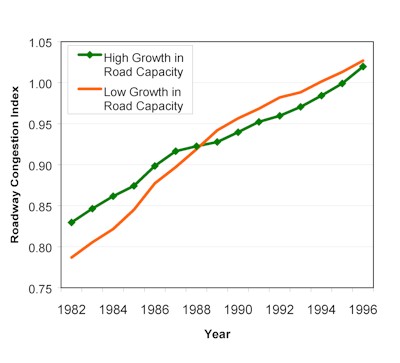
In addition, to assure that the results shown above were not anomalous, we analyzed the effect of road building according to the other indicators for congestion used by TTI – Excess Fuel Use Per Capita, Delay Per Capita, and Roadway Congestion Index. The results of this analysis are shown in Figures 3, 4 and 5. These figures show that metro areas that invested heavily in road building fared no better than those that did not.
Figure 3: Excess Fuel Per Capita (Mean Gallons)
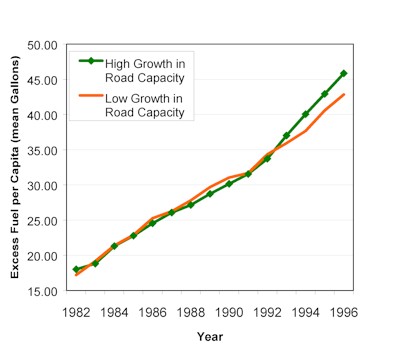
Figure 4: Delay Per Capita (Mean Person-Hours)
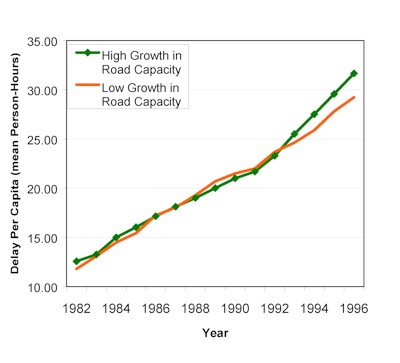
Figure 5: Roadway Congestion Index (Mean)
Note that this analysis did not control for other factors which might influence congestion levels, such as changes in population, economic activity, and land use changes. However, the large size of the data set (70 metropolitan areas) and the long duration of the study period (15 years) make it more likely for underlying relationships to emerge. Therefore, if road building were an effective congestion relief strategy, we should be able to observe it in this analysis.
Why the Results Aren’t Surprising
What does this mean for the average person in these metro areas? Clearly, congestion levels are continuing to rise. But these results also show that metro areas that invested heavily in road construction did not end up any better off than those that didn’t.
There is substantial evidence that demonstrates that building new roads often increases congestion. A well-established body of research shows that new lanes tend to get filled up with new traffic within a few years, particularly if surrounding routes are also congested. This phenomenon—often called "induced traffic"—occurs when road capacity is expanded near congested routes and drivers flock to the new facility hoping to save time, even if they have to travel a great deal farther to achieve it. Also, the new roadways tend to draw people who would otherwise avoid congested conditions or take alternative modes to their destinations. The result is an overall increase in the total amount of driving and the total number of automobile trips in the region—not just the redistribution of traffic from surrounding areas.
This theory has been strongly supported by empirical evidence. Since the 1940s, dozens of traffic studies have found that traffic inducement does indeed occur. New studies continue to support this hypothesis. The most notable of these covers 30 urban counties in California from 1973 to 1990. The authors, UC Berkeley researchers Mark Hansen and Yuanlin Huang, found that at the metropolitan level, every 1% increase in new lane-miles generated a 0.9% increase in traffic in less than five years, which led them to conclude that "With so much induced demand, adding road capacity does little to reduce congestion."
In spite of these findings, many transportation agencies still insist that highway construction and road widenings are a viable means of relieving congestion. One such road, a segment of I-287 in northern New Jersey, filled up with traffic (especially trucks) just two years after construction, prompting Princeton University Professor David Bernstein to complain that "It’s as if we hadn’t learned anything in the last 50 years."
Avoiding the Same, Expensive Mistakes
The time has come for transportation officials to stop making congestion relief claims to bolster highway proposals. Not only has road construction proven to be an ineffective congestion relief strategy, but it is an expensive one as well. According to researchers at the U.S. Department of Transportation, the construction of one ordinary lane-mile of urban highway commonly costs between $3.4 million and $7.8 million. For special projects involving major engineering, costs can exceed $100 million per lane-mile. Using a conservative estimate of $5 million per lane-mile, we estimate that over the 15 year period included in the TTI data, metro areas that invested heavily in road expansion projects spent $22 billion more than areas that built fewer new lane-miles, yet failed to produce lower congestion levels.
The amount of money spent so far pales in comparison to what might be spent if transportation officials continue to invest in road building as a means of relieving congestion. Calculating the projected growth rates for traffic and congestion in the 70 metro areas, TTI estimated the number of lane-miles "needed" to maintain current congestion levels, to illustrate the seriousness of congestion growth. We estimated the price tag for all this new roadway construction in Appendix B. The staggeringly large sums of money that would be required for this construction underscore the political challenges of funding such projects. Does a family of four in the Nashville metro area, for example, want to pay $3,243 per year to build their way out of congestion, particularly given the low likelihood that this strategy would succeed?
New Directions and Opportunities for Congestion Relief
Given the doubts about the effectiveness of road construction as a congestion relief strategy, metropolitan areas should start investing in more promising strategies to manage congestion. Recognizing that there is no simple prescription to this problem, some agencies have begun to develop integrated approaches that include expanding the choices available to travelers (e.g. transit, walking, bicycling, ridesharing, commuter rail), pricing strategies (e.g. roadway tolling, transit incentives), telecommunications, and travel demand management. Land use measures also play an important role in reducing automobile dependence and congestion. Studies have shown that communities that are dense, possess a mix of uses (residential, commercial, civic, etc.) and are well-served by transit exhibit less automobile use. Such areas have been targeted by a Fannie Mae "Location-Efficient Mortgage" pilot program, which is based on the principle that less driving will result in cost savings to home buyers that can be used to finance a larger mortgage. Similarly, a recent analysis of land use and transportation in Portland, Oregon, found that households in low-density car-reliant suburbs make roughly 7.7 vehicle trips per day whereas households in transit-oriented neighborhoods make 6.05 trips per day—more than 20% less.
International transportation research has yielded other promising insights: the reduction of roadway capacity actually reduces traffic in most cases because people shift to transit, walking, bicycling and other modes of travel. In 1998, British researchers analyzed 60 road closures worldwide and found that on average, traffic decreased by 25 percent when a road was closed. In some cases, they found that an astonishing 60 percent of the driving trips disappeared.
One example of this was London’s Hammersmith Bridge, which in February 1997 was closed to all traffic except buses and cyclists. London’s Transport Department surveyed people who used the bridge a few days before it closed, and then contacted the same people in the weeks following the closure. Of the commuters who used the bridge to get to work, some switched to public transit and others chose to walk or bike. Overall, 21 percent no longer drove to work. And remarkably, congestion in the surrounding areas has not markedly increased. The results of these studies led researchers to say that "we conclude that measures which reduce or reallocate road capacity, when well-designed and favoured by strong reasons of policy, need not automatically be rejected for fear that they must inevitably cause unacceptable congestion."
In the United States, metropolitan areas are free to invest in a broader range of innovative congestion relief measures. In 1998, Congress provided over $1.6 billion per year for the next 6 years to fund innovative projects along these lines in the Transportation Equity Act for the 21st Century Act (TEA-21). This funding source, the Congestion Mitigation and Air Quality Improvement Program (CMAQ), is limited to metropolitan areas that have high levels of air pollution (i.e. in "non-attainment" with the federal government’s air quality standards). However, all metro areas may spend a large portion of their other highway and transportation funding on innovative congestion relief projects because of TEA-21’s flexible funding provisions, which allow local and state governments to choose how to spend their federal transportation dollars.
Conclusion and Recommendations
Our analysis of the 15 years of data contained in TTI’s study on congestion in 70 metro areas adds to the growing body of evidence that tells us that highway construction is an ineffective means of managing congestion. In fact, numerous studies indicate that highway construction often generates more traffic, raising congestion levels. Given the enormous costs of roadway construction, our transportation officials need to investigate a broader menu of congestion relief measures that include other transportation modes, new technology, pricing, land use, and other strategies. The federal government has provided ample funding for such efforts through both its targeted CMAQ program and its other flexible funding programs.
Characteristics of Areas Studied by TTI, Ranked by Growth in Lane-Miles (%)
Metro Area |
Roadway Congestion Index |
Population Growth |
Growth in Urban Area size (square miles) |
Population Density (persons per square mile) |
% Growth in Lane Miles (1982-1996) |
Albany-Schenectady-Troy, NY |
0.81 |
-1% |
3% |
1338 |
9% |
Buffalo-Niagara, NY |
0.78 |
0% |
52% |
1886 |
9% |
Boston, MA |
1.09 |
6% |
27% |
2606 |
14% |
Eugene-Springfield, OR |
0.92 |
11% |
31% |
2000 |
14% |
Fresno, CA |
0.78 |
54% |
75% |
3029 |
16% |
Tacoma, WA |
1.18 |
40% |
36% |
1735 |
17% |
Denver, CO |
1.12 |
31% |
15% |
1853 |
18% |
Los Angeles, CA |
1.57 |
23% |
23% |
5443 |
18% |
Cleveland, OH |
1.02 |
6% |
24% |
2385 |
18% |
Spokane, WA |
0.84 |
18% |
10% |
1970 |
18% |
New York, NY-Northeastern NJ |
1.18 |
3% |
10% |
4900 |
20% |
El Paso, TX-NM |
0.80 |
34% |
57% |
2574 |
20% |
Salem, OR |
0.88 |
13% |
7% |
2400 |
20% |
San Francisco-Oakland, CA |
1.33 |
18% |
35% |
3705 |
21% |
Columbus, OH |
1.01 |
21% |
56% |
2126 |
21% |
Cincinnati, OH-KY |
1.07 |
12% |
16% |
1946 |
21% |
Seattle-Everett, WA |
1.27 |
35% |
25% |
2407 |
22% |
San Diego, CA |
1.23 |
44% |
23% |
3420 |
22% |
San Jose, CA |
1.11 |
33% |
17% |
3358 |
22% |
Beaumont, TX |
0.76 |
22% |
24% |
1333 |
25% |
Dallas, TX |
1.11 |
27% |
16% |
1436 |
25% |
Detroit, MI |
1.24 |
-1% |
20% |
2890 |
26% |
Omaha, NE-IA |
1.00 |
11% |
15% |
2467 |
26% |
Milwaukee, WI |
1.03 |
3% |
2% |
2232 |
28% |
Philadelphia, PA-NJ |
1.07 |
29% |
55% |
3498 |
29% |
Brownsville, TX |
0.79 |
50% |
50% |
3000 |
29% |
Miami-Hialeah, FL |
1.34 |
18% |
32% |
3796 |
29% |
Colorado Springs, CO |
0.74 |
43% |
57% |
1455 |
29% |
Honolulu, HI |
1.10 |
24% |
61% |
3811 |
30% |
Baltimore, MD |
1.09 |
26% |
64% |
2899 |
30% |
Kansas City, MO-KS |
0.81 |
23% |
40% |
1740 |
31% |
Indianapolis, IN |
1.00 |
16% |
17% |
2041 |
31% |
Rochester, NY |
0.87 |
-3% |
16% |
1851 |
32% |
San Antonio, TX |
0.99 |
29% |
19% |
2402 |
32% |
Fort Worth, TX |
1.01 |
18% |
19% |
1328 |
33% |
Oklahoma City, OK |
0.91 |
53% |
55% |
1508 |
33% |
Pittsburgh, PA |
0.85 |
7% |
39% |
2042 |
34% |
Hartford-Middletown, CT |
0.93 |
12% |
7% |
1693 |
34% |
Norfolk, VA |
0.96 |
31% |
5% |
1210 |
34% |
St. Louis, MO-IL |
1.05 |
9% |
31% |
2376 |
34% |
New Orleans, LA |
1.09 |
3% |
9% |
3014 |
34% |
Ft. Lauderdale-Hollywood-Pompano Beach, FL |
1.03 |
39% |
44% |
3031 |
35% |
Boulder, CO |
0.79 |
31% |
100% |
2625 |
36% |
Minneapolis-St. Paul, MN |
1.12 |
29% |
46% |
1860 |
36% |
Allentown-Bethlehem-Easton, PA-NJ |
0.87 |
16% |
50% |
2385 |
38% |
Harrisburg, PA |
0.88 |
15% |
72% |
1465 |
39% |
Corpus Christi, TX |
0.78 |
24% |
15% |
1590 |
39% |
San Bernardino-Riverside, CA |
1.22 |
43% |
30% |
2596 |
41% |
Washington, DC-MD-VA |
1.43 |
28% |
26% |
3460 |
42% |
Sacramento, CA |
1.07 |
48% |
41% |
3114 |
46% |
Chicago, IL-Northwestern IN |
1.34 |
11% |
44% |
2865 |
46% |
Charlotte, NC |
0.98 |
63% |
60% |
1781 |
46% |
Jacksonville, FL |
0.99 |
33% |
25% |
1262 |
47% |
Louisville, KY-IN |
1.04 |
8% |
10% |
2114 |
47% |
Orlando, FL |
0.91 |
73% |
36% |
2049 |
48% |
Las Vegas, NV |
1.20 |
139% |
244% |
3909 |
50% |
Houston, TX |
1.11 |
28% |
10% |
1821 |
51% |
Portland-Vancouver, OR-WA |
1.16 |
26% |
34% |
2713 |
52% |
Memphis, TX-AR-MS |
1.11 |
26% |
30% |
2110 |
53% |
Nashville, TN |
1.00 |
25% |
54% |
1068 |
53% |
Providence-Pawtucket, RI-MA |
0.96 |
9% |
16% |
1731 |
54% |
Bakersfield, CA |
0.68 |
59% |
157% |
2028 |
55% |
Albuquerque, NM |
1.01 |
27% |
31% |
2036 |
57% |
Salt Lake City, UT |
1.00 |
32% |
38% |
1808 |
57% |
Phoenix, AZ |
1.14 |
64% |
96% |
2167 |
57% |
Atlanta, GA |
1.24 |
53% |
22% |
1384 |
69% |
Tampa, FL |
1.06 |
52% |
47% |
1592 |
73% |
Laredo, TX |
0.73 |
58% |
80% |
3333 |
90% |
Austin, TX |
1.03 |
63% |
32% |
1570 |
107% |
Tucson, AZ |
1.02 |
42% |
87% |
2286 |
130% |
Estimated Cost of New Lane-Miles for a Family of Four
Rank |
Metro Area |
New Lane-Miles Required Annually to Hold Congestion Levels Constant, as Estimated by TTI |
Cost of Those Lanes, as Estimated by STPP |
Cost per Year for a Family of Four |
1 |
Nashville, TN |
101.35 |
$506,750,000 |
$3,243 |
2 |
Austin, TX |
92.88 |
$464,400,000 |
$2,996 |
3 |
Orlando, FL |
147.75 |
$738,750,000 |
$2,801 |
4 |
Indianapolis, IN |
138.18 |
$690,900,000 |
$2,764 |
5 |
Corpus Christi, TX |
39.58 |
$197,900,000 |
$2,554 |
6 |
Jacksonville, FL |
98.46 |
$492,300,000 |
$2,401 |
7 |
Albuquerque, NM |
62.81 |
$314,050,000 |
$2,243 |
8 |
Atlanta, GA |
275.32 |
$1,376,600,000 |
$2,229 |
9 |
Charlotte, NC |
61.71 |
$308,550,000 |
$2,165 |
10 |
Louisville, KY-IN |
82.94 |
$414,700,000 |
$1,987 |
11 |
Kansas City, MO-KS |
129.19 |
$645,950,000 |
$1,928 |
12 |
San Antonio, TX |
108.06 |
$540,300,000 |
$1,764 |
13 |
Fort Worth, TX |
102.94 |
$514,700,000 |
$1,615 |
14 |
Tucson, AZ |
50.41 |
$252,050,000 |
$1,575 |
15 |
Tampa, FL |
62.11 |
$310,550,000 |
$1,515 |
16 |
Bakersfield, CA |
27.61 |
$138,050,000 |
$1,513 |
17 |
Laredo, TX |
11.05 |
$55,250,000 |
$1,473 |
18 |
Beaumont, TX |
10.28 |
$51,400,000 |
$1,469 |
19 |
Harrisburg, PA |
22.22 |
$111,100,000 |
$1,411 |
20 |
St. Louis, MO-IL |
133.72 |
$668,600,000 |
$1,324 |
21 |
Oklahoma City, OK |
63.75 |
$318,750,000 |
$1,301 |
22 |
Ft. Lauderdale-Hollywood-Pompano Beach, FL |
91.23 |
$456,150,000 |
$1,229 |
23 |
Memphis, TN-AR-MS |
55.85 |
$279,250,000 |
$1,164 |
24 |
Omaha, NE-IA |
32.22 |
$161,100,000 |
$1,161 |
25 |
Portland-Vancouver, OR-WA |
73.92 |
$369,600,000 |
$1,160 |
26 |
Phoenix, AZ |
134.09 |
$670,450,000 |
$1,146 |
27 |
Las Vegas, NV |
61.52 |
$307,600,000 |
$1,145 |
28 |
Colorado Springs, CO |
22.09 |
$110,450,000 |
$1,105 |
29 |
El Paso, TX-NM |
33.14 |
$165,700,000 |
$1,096 |
30 |
San Jose, CA |
83.88 |
$419,400,000 |
$1,052 |
31 |
Dallas, TX |
120.28 |
$601,400,000 |
$1,050 |
32 |
Denver, CO |
85.73 |
$428,650,000 |
$969 |
33 |
Houston, TX |
147.91 |
$739,550,000 |
$967 |
34 |
Columbus, OH |
48.44 |
$242,200,000 |
$959 |
35 |
Salt Lake City, UT |
41.69 |
$208,450,000 |
$932 |
36 |
Minneapolis-St. Paul, MN |
102.19 |
$510,950,000 |
$908 |
37 |
Boulder, CO |
4.71 |
$23,550,000 |
$897 |
38 |
Milwaukee, WI |
55.9 |
$279,500,000 |
$894 |
39 |
Norfolk, VA |
45.11 |
$225,550,000 |
$893 |
40 |
Albany-Schenectady-Troy, NY |
21.33 |
$106,650,000 |
$862 |
41 |
Allentown-Bethlehem-Easton, PA-NJ |
19.71 |
$98,550,000 |
$848 |
42 |
Cincinnati, OH-KY |
52.55 |
$262,750,000 |
$831 |
43 |
Brownsville, TX |
5.37 |
$26,850,000 |
$796 |
44 |
Washington, DC-MD-VA |
128.42 |
$642,100,000 |
$742 |
45 |
Providence-Pawtucket, RI-MA |
33.16 |
$165,800,000 |
$737 |
46 |
Baltimore, MD |
76.91 |
$384,550,000 |
$717 |
47 |
New Orleans, LA |
39.88 |
$199,400,000 |
$715 |
48 |
Detroit, MI |
133.65 |
$668,250,000 |
$709 |
49 |
Chicago, IL-Northwestern IN |
271.8 |
$1,359,000,000 |
$692 |
50 |
Fresno, CA |
18.27 |
$91,350,000 |
$689 |
51 |
San Bernardino-Riverside, CA |
46.2 |
$231,000,000 |
$684 |
52 |
Miami-Hialeah, FL |
69.57 |
$347,850,000 |
$679 |
53 |
Eugene-Springfield, OR |
7 |
$35,000,000 |
$667 |
54 |
Pittsburgh, PA |
64.24 |
$321,200,000 |
$666 |
55 |
Spokane, WA |
9.89 |
$49,450,000 |
$609 |
56 |
Hartford-Middletown, CT |
19.16 |
$95,800,000 |
$603 |
57 |
Cleveland, OH |
55.94 |
$279,700,000 |
$602 |
58 |
Sacramento, CA |
36.06 |
$180,300,000 |
$586 |
59 |
Rochester, NY |
17.74 |
$88,700,000 |
$572 |
60 |
Salem, OR |
5.05 |
$25,250,000 |
$561 |
61 |
Boston, MA |
84.04 |
$420,200,000 |
$558 |
62 |
Honolulu, HI |
19.39 |
$96,950,000 |
$550 |
63 |
Philadelphia, PA-NJ |
95.99 |
$479,950,000 |
$365 |
64 |
New York, NY-Northeastern NJ |
273.58 |
$1,367,900,000 |
$319 |
65 |
Los Angeles, CA |
185.7 |
$928,500,000 |
$304 |
66 |
Tacoma, WA |
8.64 |
$43,200,000 |
$293 |
67 |
Buffalo-Niagara, NY |
15.74 |
$78,700,000 |
$293 |
68 |
San Diego, CA |
34.12 |
$170,600,000 |
$266 |
69 |
Seattle-Everett, WA |
25.2 |
$126,000,000 |
$258 |
70 |
San Francisco-Oakland, CA |
35.13 |
$175,650,000 |
$181 |
Click here to get the Press Release
